IntroductionFrom Wikipedia:
An image histogram is a type of histogram that acts as a graphical representation of the tonal distribution in a digital image. It plots the number of pixels for each tonal value. By looking at the histogram for a specific image a viewer will be able to judge the entire tonal distribution at a glance.
The histogram is arguably one of the greatest advantages of digital photography over film photography yet it is also one of the most misunderstood and least used tools. The main reason is that most beginning photographers simply don’t understand how to read a histogram and how to use it to their advantage.
The Anatomy of a Histogram:
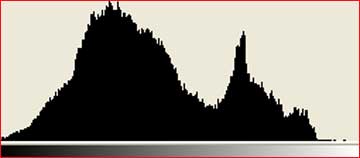
Histograms aren’t only used in photography; in mathematics a histogram refers to the graphical representation of data. This is exactly the same in digital photography. The histogram is a really big bar graph showing how much of each tone exists in your exposure (image). The horizontal axis of the graph represents the tonal qualities (pure blac, pure white and the varying shades of gray) while the vertical axis represents the number of pixels in that particular tone. The left side of the histogram represents pure black (0) and the right side represents pure white (255).
The vertical axis represents the size of the area that is captured in each one of these zones. Thus, the histogram for a very dark image will have the majority of its data points on the left side and center of the graph. Conversely, the histogram for a very bright image with few dark areas and/or shadows will have most of its data points on the right side and center of the graph.